by logisticsplus | Nov 1, 2019 | News
 The United States International Trade Commission (USITC) just released its annual “The Year in Trade” report for 2018. This detailed report features all of the global trade trends from 2018. Some of the key elements to this report are exchange rate trends, administration of U.S. trade laws, global trade agreements, new trade relations, and global economic trends, among others. Highlighted below are a few of the trade trends we saw in 2018.
Trade Activities With Major Trading Partners
The European Union as a single entity continued to be the United States’ largest trading partner in 2018. The EU member countries accounted for 6 of the top 15 U.S. trading partners. Leading U.S. exports to the EU included civilian aircraft, engines, and crude petroleum. After the EU, China remained the United States’ largest single-country trading partner, accounting for 15.7% of total U.S. merchandise trade. Leading U.S. imports from China in 2018 were cellphones, computers and tablets, and computer parts. Canada remained third on the list and accounted for 14.7% of total U.S. merchandise trade.
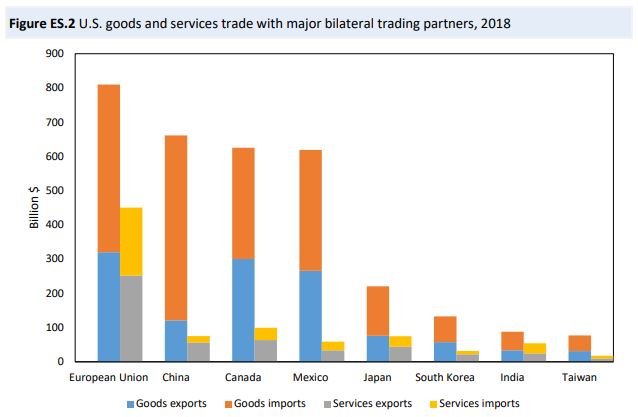
In 2018, Canada was the United States’ second-largest single-country trading partner after China for the fourth consecutive year. The value of U.S. two-way merchandise trade with Canada rose 6.1 percent to $617.1 billion in 2018, accounting for 14.7 percent of total U.S. merchandise trade with the world. Both U.S. merchandise exports and imports with Canada increased in 2018 from the previous year, but imports outpaced exports, resulting in a $2.6 billion increase (15.8 percent) in the U.S. merchandise trade deficit with Canada to $19.7 billion. Leading U.S. exports to Canada included crude petroleum; civilian aircraft, engines, and parts; motor vehicles—both for passengers and for goods transport—as well as their parts and accessories; and light oils. Top U.S. imports from Canada included crude petroleum; passenger motor vehicles and their parts and accessories; refined petroleum products; natural gas; and coniferous wood and products.
In 2018, Mexico was the United States’ third-largest single-country merchandise trading partner. U.S. two-way merchandise trade with Mexico amounted to $611.5 billion in 2018, an increase of 9.7 percent from 2017. Mexico accounted for 14.5 percent of U.S. trade with the world. U.S. merchandise exports to Mexico totaled $265.0 billion in 2018, and U.S. merchandise imports from Mexico amounted to $346.5 billion. Both U.S. merchandise imports and exports with Mexico increased in 2018 from the previous year. Leading U.S. exports to Mexico included light oils; refined petroleum products; computer parts and accessories; diesel engines; semiconductors; parts and accessories of bodies (including cabs) for motor vehicles; and civilian aircraft, engines, and parts. Leading U.S. imports from Mexico included passenger motor vehicles, motor vehicles for goods transport, telecommunications equipment, road tractors for semi-trailers, color TV reception apparatus, and insulated ignition wiring sets.
Global Economic Trends
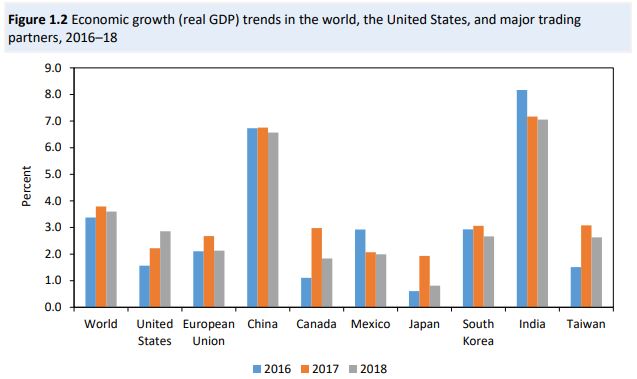
Overall, the global economic growth rate fell slightly from 3.8% in 2017 to 3.6% in 2018. The slow global growth seen in 2018 is attributed to short-term uncertainty in economies due to trade tensions and financial pressures in emerging markets. The United States was the only economy to show improvement in it’s growth rate from 2017 to 2018.
U.S. Dollar Exchange Rate Trends
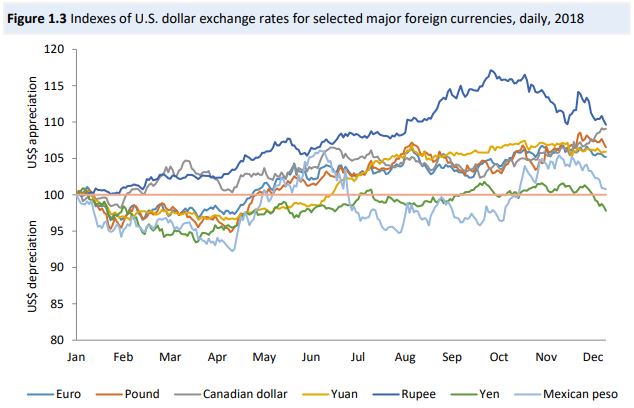
The U.S. dollar appreciated in comparison to other currencies, rising 5.5% between January and December 2018. The previous year, the U.S. dollar depreciated by 6.3%. The upwards trend in 2018 was driven partly by the Federal Open Market Committee’s four interest rate hikes, along with a lower than expected unemployment rate.
To read the full report, The Year in Trade 2018, published by the United States International Trade Commission, click here.
If your company has import or export needs, you should consider working with Logistics Plus. Global trade compliance management is as important as it has ever been. In the U.S. Logistics Plus more than a dozen locations that can help you with your transportation and logistics needs; and our Customs Brokerage staff can also help you clear customs for imports at any port in the United States. Additionally, Logistics Plus now has locations at 50 offices in over 20 countries. As always, you can find any of our worldwide employees in our online global directory.


by logisticsplus | Aug 28, 2018 | News
The United States International Trade Commission (USITC) just released its updated “The Year in Trade 2017” report. This report covers all of the global trade trends from 2017. Included in this report are exchange rate trends, trade laws and regulations, global economic trends, regional trade activity, global trade agreements, and new trade relations, among other topics. Let’s take a look at some of the most intriguing and important trade trends that occurred in 2017.
Trade Activities With Major Trading Partners
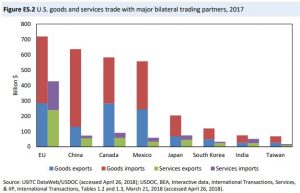
As expected, China was again named the United States largest single-country trading partner based on two-way merchandise trade in 2017. Merchandise trade with China accounts for 16.4 percent of total U.S. trades and amounts to $635.9 billion in trade. Behind China is Canada for the third consecutive year. U.S. and Canada trade rose 7 percent from the previous year and amounted to $582.4 billion in 2017. Following China and Canada is Mexico with a value of $557 billion in 2017 trade. The figure below includes the top 7 single-countries the U.S. trades with, and also the E.U. which includes all countries the U.S. trades with in Europe.
U.S. Exports and Imports
In 2017, transportation equipment was the largest U.S. export sector accounting for 21 percent of all exports. Close behind was electronics (17.3 percent), and chemical related products (14.7 percent). The top individual export product were civilian aircraft, engines, and parts, along with refined petroleum products. The biggest U.S. import in 2017 was electronic products, which totaled for 20.7 percent of U.S. imports. On an individual basis, passenger motor vehicles were the largest U.S. import valued at $186.4 billion. China was once again the leading source of U.S. imports in 2017.
Exchange Rate Trends
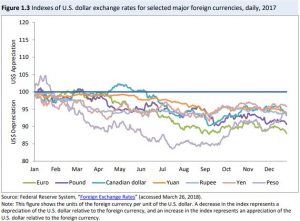
Overall, the U.S. dollar depreciated in 2017, falling 6.3 percent on the broad dollar index. This downward trend was mainly driven by the depreciation of the U.S. dollar compared to other major world currencies. The U.S. dollar fell by 12 percent against the euro, 9.4 percent against the pound (UK), 6.8 percent against the Canadian dollar, and 6.1 percent against the Mexican peso. Several major U.S. investment banks noted that the euro and pound were recovering from an early drop due to the uncertainty of the Brexit vote. The figure below shows the U.S. dollar exchange rate compared to other major world currencies.
U.S. GDP in 2017
The United States had a $19.4 trillion economy in 2017, and the economy grew faster in 2017 than it did in 2016. U.S. real gross domestic product (GDP) increased 2.3 percent in 2017 compared to the growth rate of 1.5 percent in 2016. The main factors driving this high growth rate were due to four industries- professional and business services; finance, insurance, real estate, rental, and leasing; manufacturing; and retail trade.
To read the full report, The Year in Trade 2017, published by the United States International Trade Commission, click here.
If your company has import or export needs, you should consider working with Logistics Plus. In the U.S. we have more than a dozen locations that can help you with your transportation and logistics needs; and our Customs Broker Solutions staff can also help you clear customs for imports at any port in the United States. Additionally, Logistics Plus now has locations at 50 offices in 22 countries. As always, you can find any of our worldwide employees in our online global directory.


by Marketing | Mar 20, 2018 | News
The air freight industry has experienced some radical shifts throughout the years, and 2018 will be no exception. Headwinds are in store for international air freight transporters as they manage available air capacity, especially during peaking season. Capacity is likely to become harder to find. If large shippers acquire a larger slice of the available capacity, small and medium-sized shippers will find it more problematic to secure air space for their freight. Peak season will also add more pressure on available capacity. At certain times of the year, there is more freight flowing than capacity putting even more pressure on supply chains.
The International Air Transport Association (IATA) confirmed full-year 2017 data for global air cargo markets reporting that demand grew by 9.0%, which was double the annual growth recorded in 2016. This outperformed the industry-wide growth in both cargo capacity and in passenger demand. There were improvements in load factors, yields and revenues. Air cargo is still a very hard-hitting and competitive business, but the developments seen in 2017 far exceeded expectations.
Regional Performance
Airlines in all regions reported an increase in demand in 2017:
- Asia-Pacific carriers saw demand in freight volumes grow 5.6% in December 2017 compared to the same period in 2016 and capacity grow by 2.2%.
- North American airlines saw freight demand increase by 5.4% in December 2017 year-on-year and capacity increase of 2.2%.
- European airlines posted a 5.0% year-on-year increase in freight demand in December and a capacity rise of 3.2%.
- Middle Eastern carriers’ freight volumes increased 6.3% year-on-year in December and capacity increased 4.7%.
- Latin American airlines experienced a growth in demand of 4.9% in December and a capacity increase of 11.6%.
- African carriers’ posted the fastest growth in year-on-year freight volumes, up 15.6% in December 2017 and a capacity increase of 7.9%.
Total air freight traffic market shares by region in terms of freight ton kilometers (FTKs) were: Asia-Pacific 37%, Europe 24.2%, North America 20.5%, Middle East 13.7%, Latin America 2.7%, Africa 1.9%.
Over the last few years, the evolution of digitization within the air industry has steadily increased. As in most businesses, big data obtained in real time, from real events, combined with flexible management, is better serving air carriers to take a more competent approach to traffic preparation and infrastructure.
Top 5 air freight logistics tech trends for 2018
It’s March of 2018 and the e-commerce-driven demand for airfreight show few signs of reduction. While the overall position for the year is generally positive, there are still various holdups in the supply chain that need to be addressed, including amplified safety and transparency, enhanced product quality and quicker processing of cross-border deliveries. Fortunately, there are numerous technology firms willing to help forwarders, carrier and shippers resolve these issues and strengthen the overall efficiency of air cargo transport.
According to Air Cargo World, here are the top 5 tech trends to look out for in 2018:
- Flexible warehousing. Today’s warehouses have been altered into dynamic avenues of logistics activity. It’s no longer about just one big building, but a network of large and small facilities tactically placed to serve the changing needs of customers. The warehouses of tomorrow are more and more dependent upon robotic vehicles and are intended to be customizable to meet today’s on-demand desires, serving as both retail channels and e-commerce distribution centers.
- Interest in blockchain technology. Blockchain is the air freight catchword that refuses to go away – primarily because there is so much potential for it to drive and secure the mechanics of the supply chain. By creating a shared, automated record of all the dealings that occur in a network, blockchain technology allows trusted parties limited admission to data in real time. The companies that hope to present the technology as a way of digitizing global cross-border trade say it’s one of the best methods to reach transparency without compromising security or privacy.
- The Internet of things. The IoT is still acquiring enough traction in the logistics field that we may begin to see some extensive implementation this year, using fixed technology such as radio-frequency identification (RFID) and GPS tracking systems. Since air freight involves the movement of so many concrete items – from ULDs to trucks to 777s – it is complementary to IoT technology.
- Unmanned Arial Vehicles (UAVs). Small drones designed to deliver minor, high-value merchandise, such as pharmaceuticals to remote hospitals, have been around for years. All of them are hindered by the same restrictions from most world regulatory agencies that ban their use beyond line-of-sight piloting and above a few hundred feet, out of concern for public safety. This is a major issue, and finding a sensible accommodation will be crucial to development. The types of drone aircraft being conversed this year are not the same as the little quad- or hex-copters favored by hobbyists. For 2018 the discussion will shift to much larger machines, capable of carrying larger payload several kilometers away.
- Artificial Intelligence. There is great potential for Artificial intelligence (A.I.), which integrates the collected “big data” from the supply chain and uses machine learning to recognize unseen patterns of daily e-commerce. With the overwhelming capabilities of the newest data-driven analytical software, shippers and forwarders may soon be able to predict bottlenecks like weather events, traffic slowdowns and other unforeseen variables that can hinders the supply chain. A.I. can also be used for anticipating not just possible problems, but future buying patterns, so shippers can better evaluate when certain goods will be most prevalent and can respond rapidly to move these commodities to distribution center closer to their clients.
Looking Ahead
Understanding the trends and opportunities will be the key to maintaining stability in 2018. Start by evaluating your current transit times and deliver dates, and assessing how they influence your ability to implement an effective air freight strategy. Many businesses discover that broadening transit times alone can often save between 15% and 20%.
You can also choose to do business with a large, stable freight forwarder, who can help you navigate the challenges of finding space availability, especially during peak shipping season. Let Logistics Plus be your trusted partner in navigating the ever changing and increasingly complex air freight and cargo environment!

by logisticsplus | Jan 11, 2018 | News
 There’s a lot going on in the world of logistics right now. At Logistics Plus, we’ve been keeping pace with many of the current transportation and logistics trends, and here are some things to watch in both trucking and global logistics over the next several years.
- Automation. Labor shortages and capacity constraints are driving deep investments in technology and automation, such as load matching, robotics, artificial intelligence, machine learning, APIs, and self-driving vehicles. Many 3PLs are dedicating resources to R&D and innovations, and employees are being empowered to quickly anticipate and address customer demands.
- Ecommerce. Global e-commerce logistics costs are expected to have a 17% CAGR through 2020. A CAGR of that multiple hasn’t been seen in the 3PL market for some time. Traditional bricks-and-mortar store-based distribution models are being replaced with less forgiving e-commerce-based fulfillment models that provide less buffer inventory, require faster transit times, and that demand more precise pick-up and delivery times (including same-day deliveries).
- Amazon. The 900-pound gorilla of the freight world continues to build out its own transportation and logistics network, challenging 3PLs to think outside the box. 3PLs must consider how to both compete and partner with Amazon to deliver the e-commerce and omnichannel logistics solutions retailers will require.
- Taxes and Legislation. The U.S. tax bill will be a huge shot in the arm for the economy. This could lead to much-needed pay increases and capital expenditures as transportation companies work to improve their fleets and increase their capacities. Additionally, the passing of proposed infrastructure funding by Congress could address critical deficiencies in the U.S. transportation network.
- Global Growth. Regional growth in China, Mexico, and India will continue to drive a need for effective logistics solutions in those countries. Tightening regulations in China are resulting in some manufacturing and supply chain shifts to other Asian countries. The fast delivery requirements of e-commerce are leading to near-sourcing trends as manufacturers and distributors try to locate inventory closer to consumers.
- Freight Forwarding. The international freight forwarding industry is riding tailwinds into 2018. Faster speed expectations are driving shifts from ocean to air shipments. Meanwhile, ocean carriers are adding newer and larger ships which could result in excess ocean capacity and lower rates.
- Consolidation. M&A activity within the logistics industry will continue in this seller-friendly market as 3PLs look for both growth and technology opportunities. Larger mergers are expected in the high-velocity fulfillment e-commerce area, while strategic partnerships – particularly outside the U.S.—are being created to address niche markets within core verticals and concentrated geographies.
What trends will you be watching in 2018 and beyond? What’s your most pressing logistics or supply chain challenges for the coming year? Some informational links are provided below if you are interested in further reading on trends within the transportation and logistics industry.
Key Takeaways from the 3PL Value Creation Chicago Summit 2017 (Armstrong & Associates)
Ten Trends Trucking Should Watch in 2018 (Fleet Owner)
3 Tech Trends Shaping the Future of Global Logistics (Supply Chain 247)
2018 Third-Party Logistics Study – Key Takeaways (3PL Study)


by logisticsplus | Nov 15, 2017 | News
In case you haven’t had a chance to read the 2018 Third-Party Logistics Study, here are some key takeaways from the results and findings of the 22nd annual report by Dr. C. John Langley and Infosys:
- Global Results Have Been Mixed. Overall 3PL revenues, estimated at $802B in 2016, have declined slightly over the past several years despite increases in the Asia-Pacific and North America.
- Logistics Costs Are Increasing. Logistics expenditures as a percentage of sales revenues increased to 11% in the current year, up from 10% the previous year, as a higher percentage of shippers’ transportation spend is being outsourced with 3PLs (reportedly 55% in most current year).
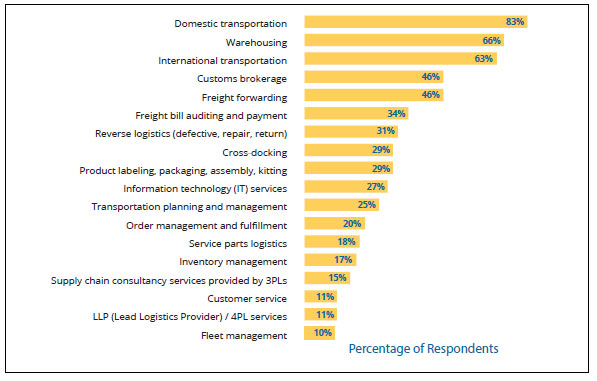
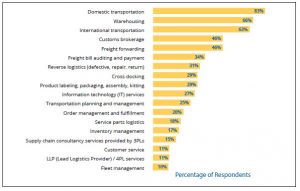 Shippers Are Outsourcing More. 61% of shippers in the study noted that they intend to increase their usage of outsourced logistics services. Domestic transportation and warehousing remain the two most outsourced logistics services; however, outsourcing of information technology (IT) services had the greatest year-over-year increase for the second consecutive year (see graph).
- The IT Satisfaction Gap Is Widening. Despite more outsourcing of IT activities, fewer shippers are satisfied with these services; an indication that, perhaps, shippers’ expectations have increased as technology has improved or because shippers are seeking enhanced analytical capabilities to help drive more effective supply chain decisions.
- 3PL Capabilities Are Expanding. As more conversations around supply chain efficiency have entered the board room, 3PL providers are refining and expanding their core competencies, which in turn is allowing shippers to focus more on their core competencies.
If you haven’t already, you should download and read the entire 2018 Third-Party Logistics Study. The authors also share some perspectives on the impact blockchains could have on logistics; automation and digitization in the supply chain; and the logistics talent revolution.
If you’re a shipper looking to outsource some or all of your transportation, logistics, or supply chain activities, let us know. We stand ready to help businesses address their most critical logistics challenges.